No edit summary |
No edit summary |
||
| Line 1: | Line 1: | ||
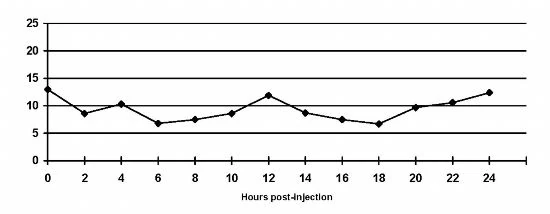
| + | [[Image:Good_reg_insulin.JPG|thumb|left|250px|In this example of a 24 hour blood glucose curve, you can see that the nadir for insulin given in the morning is at 6 hours after it's been injected. At the 12th hour after the first injection, it's time to give the evening insulin injection, and you see the nadir from the second, evening injection at 18 hours after the time the first insulin injection of the morning was given.]] |
||
{| |
{| |
||
|-valign="top" |
|-valign="top" |
||
| Line 8: | Line 9: | ||
<br>See our [[Ad scams]] page for a complete listing of pages this scammer targets.</b> |
<br>See our [[Ad scams]] page for a complete listing of pages this scammer targets.</b> |
||
|} |
|} |
||
| − | + | The lowest point on a [[blood glucose guidelines|blood glucose]] [[curve]], often considered the same as the [[peak]] of insulin activity. |
|
Looking at time activity profiles for insulin, they illustrate when and how the insulin is working. What's high or low on an insulin time activity graph usually means the opposite when considering the effect it has on blood glucose levels. When the insulin is shown on them as peaking--working hardest--this is when the blood glucose levels are at their lowest point, or nadir. |
Looking at time activity profiles for insulin, they illustrate when and how the insulin is working. What's high or low on an insulin time activity graph usually means the opposite when considering the effect it has on blood glucose levels. When the insulin is shown on them as peaking--working hardest--this is when the blood glucose levels are at their lowest point, or nadir. |
||
Revision as of 16:10, 20 January 2010
In this example of a 24 hour blood glucose curve, you can see that the nadir for insulin given in the morning is at 6 hours after it's been injected. At the 12th hour after the first injection, it's time to give the evening insulin injection, and you see the nadir from the second, evening injection at 18 hours after the time the first insulin injection of the morning was given.
 The following "remedies" have been appearing again in ads on this wiki's pages: List of ad phrases used at bottom of page.
| ||
The lowest point on a blood glucose curve, often considered the same as the peak of insulin activity.
Looking at time activity profiles for insulin, they illustrate when and how the insulin is working. What's high or low on an insulin time activity graph usually means the opposite when considering the effect it has on blood glucose levels. When the insulin is shown on them as peaking--working hardest--this is when the blood glucose levels are at their lowest point, or nadir.
Some UK medical websites[1] speak of this as the trough glucose measurement. ![]()
References
|
List of ad phrases:
"Canine Diabetes Help" |"Dogs Blood Sugar Control" | "New Dog Diabetes Help" | ||