m (Changed protection level for "Curve" ([edit=sysop] (indefinite) [move=sysop] (indefinite))) |
m (Unprotected "Curve": Bot: Unprotecting page) |
(No difference)
| |
Latest revision as of 23:26, 23 May 2012
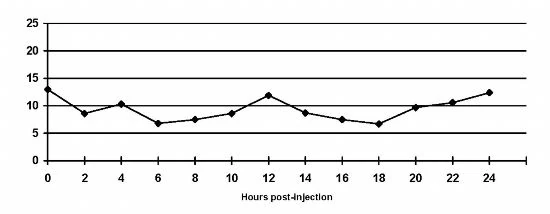
This is a nice example of a curve, where blood glucose is tested and recorded every 2 hours and the results are shown in a graph form.
A curve is the result of regular blood glucose readings taken over the space of 12 or 24 hours, on the same animal, with notes on timing and amounts of insulin and food [1]. (For how to take a reading, see Blood glucose testing.)
The curve shows the action of the insulin on the animal's system, and can be used to adjust dosage. It's useful to find the highest and lowest blood-glucose readings of the day, the peak action time of the insulin, the onset time and duration of the insulin. See also Insulin for more information on how long your particular brand of insulin is expected to last. [2]
Some people and even vets mistakenly try to base an insulin dosage on one or two readings. This is dangerously mistaken -- there's no way to know if that reading was at a high or low point in the day, or if the reading was skewed due to stress or even from being at the vet's. [3] Any change in dose should be based on at least the information of a good mini-curve.
When and how to curve[]
When first regulating, it's not unusual to take a curve or two every week. Later on, many people take a curve every few weeks, to obtain analytical data to help decide whether, and by how much, to increase or decrease the pet's insulin dosage. Some people take a 24-hour curve if their preshot and shot check numbers indicate that there may be significant differences between their pet's AM and PM cycles.
Keeping your curves, whether in written or graphed form, is an essential part of recordkeeping. Many glucometers come with an optional data cable for uploading readings to an excel sheet -- this can help tremendously too. Readings are generally taken once every 2 hours, though it's possible to be more or less frequent. The minimum useful curve is the mini-curve.
Interpreting curves[]
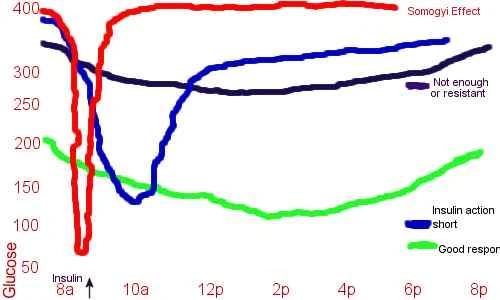
What can be seen in a curve. These overlays of hypothetical blood glucose curves show what's wrong or right with the readings turned into a graph. The red line shows what Somogyi rebound looks like on a graphed curve-extreme lows and extreme highs. The navy line indicates either not enough insulin being given or resistance to that insulin; they look alike when plotting a curve as the blood glucose values don't really get lower. The blue line indicates that the animal or person is using the insulin faster than usual-short duration. There is a response to it, as shown by the "dip" in blood glucose values, but the insulin has less than normal duration for that patient. The green line shows a pattern where the response to the insulin and its duration in that person or animal is good.
- The most desirable curve while regulating is a simple dip, from about 250, down to around 90 or 100, then back up to 250. Ideally, most of the pet's time is spent with blood glucose levels below 200.
- The lowest point on the curve (blood glucose nadir) is your peak, and you should remember the time this occurs. Use that same time for between-shot peak tests and mini-curves in future.
- A typical difficult curve when you first begin regulating is high and flat, between 300 and 500. This can indicate either not enough insulin, or too much insulin and Somogyi rebound. It may also indicate insulin resistance due to glucose toxicity. Telling the difference is difficult, and requires looking at a full dosage and curve history.
- A curve that goes down below 90 may indicate less insulin is needed.
- A curve that has a nice dip between shots, but rises too soon, may indicate that a longer-acting insulin is appropriate or that the pet needs more time to "settle" into the current dose.
References[]
- ↑ Vetsulin-About Glucose Curves. Intervet.
- ↑ Blood Glucose Curves in the Diagnosis and Regulation of Dogs With Diabetes. Pet Education.
- ↑ Bruyette, David. Blood glucose curve: interpretation. VetStream Canis.
More Information[]
- Blood Glucose Curves in the Diagnosis and Regulation of Diabetic Dogs Pet Education
- Blood Glucose Curves-Dogs BD Diabetes
- Excel sheets for graphing curves (for any pet) Gorbzilla
- Vetsulin Online Glucose Curve Generator
This online generator will also allow you to print the results out. It does NOT send any of the information you enter back to Intervet. Please note that since this is a US-based website, all values will be shown in US measurements. There is no online generator for the product under the Caninsulin name to provide non-US measurements, but there is an Excel program you can download here: - Caninsulin Curve Plotting Program
Note: this is an Excel file. Immediately on clicking the link, you'll be asked if you want to open or save the file. The program is geared for mmol/L measurement values.
- Glucose Curve Worksheet Intervet
- Glucose Curve Interpretation Intervet
- Sample curves and interpretations Caninediabetes.org
- What is a Glucose Curve? Petplace.com